
")
An integrated solution to minimize lost production times, by identifying and analyzing micro-stops of production assets, with the aim of increasing productivity.
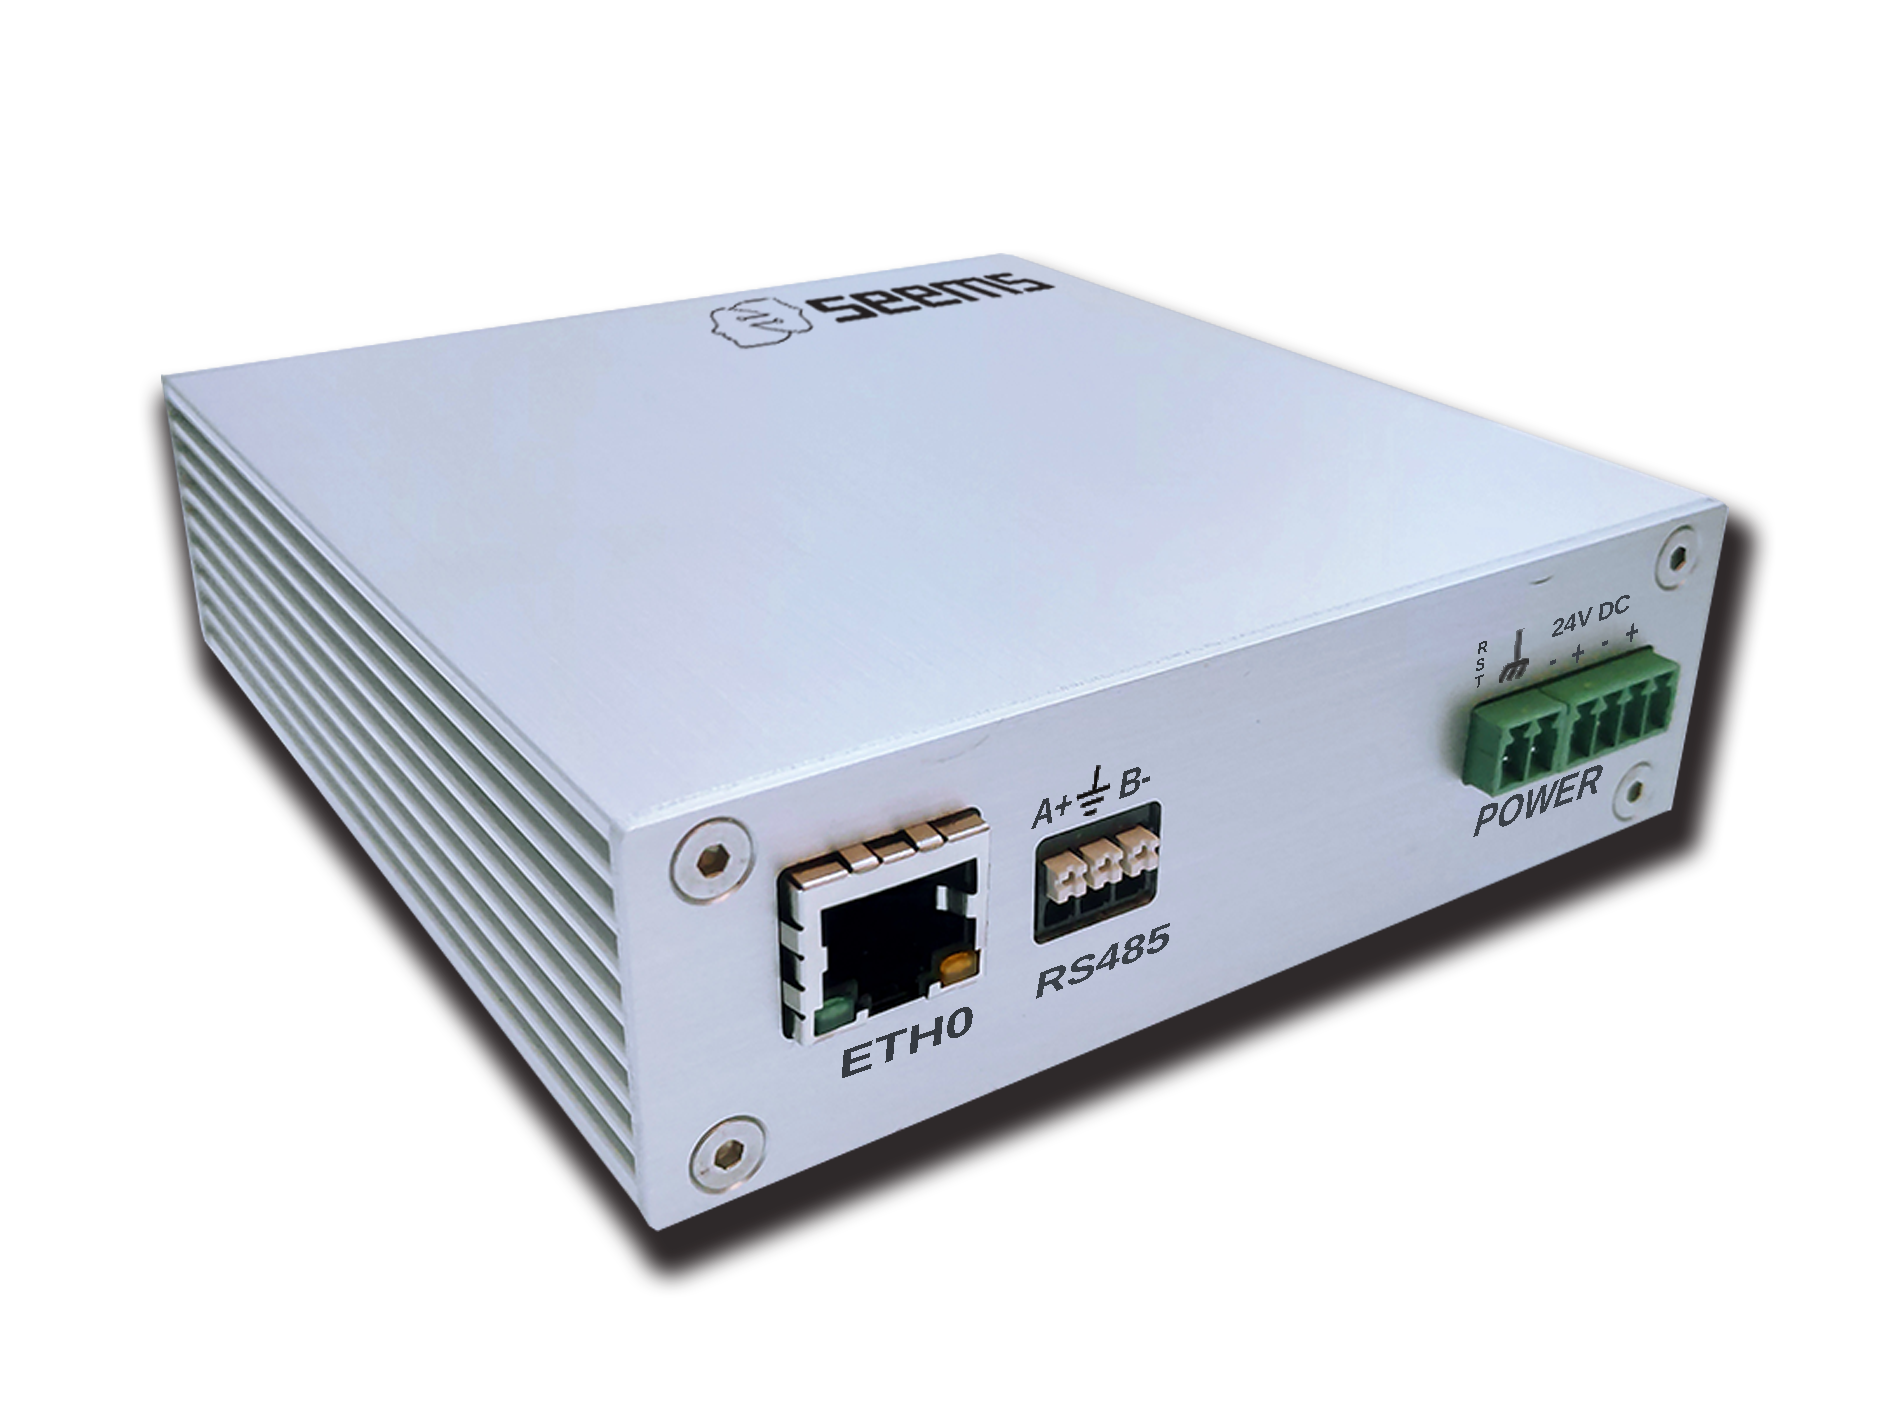
▶ Real-time monitoring of machines and facilities.
▶ Secure, web-based access to machine data.
▶ Integration of different measurements from any source (sensors, image, sound, etc.).
▶ Support of multiple types of sensors (analog, 4-20mA, voltage, digital interfaces, etc.).
▶ Pre-processing data locally, to reduce the amount of data transferred to the server/Cloud.
▶ Expandability to meet future needs simply by adding additional devices.
▶ Increased flexibility: Wired/wireless.
▶ Installation and direct operation (plug n' play).
Algorithms look for correlations and anomalies so that together with statistical (historical) analysis, they can provide:
▶ diagnosis based on root-cause analysis,
▶ predictions as well as
▶ the economic impact of events.
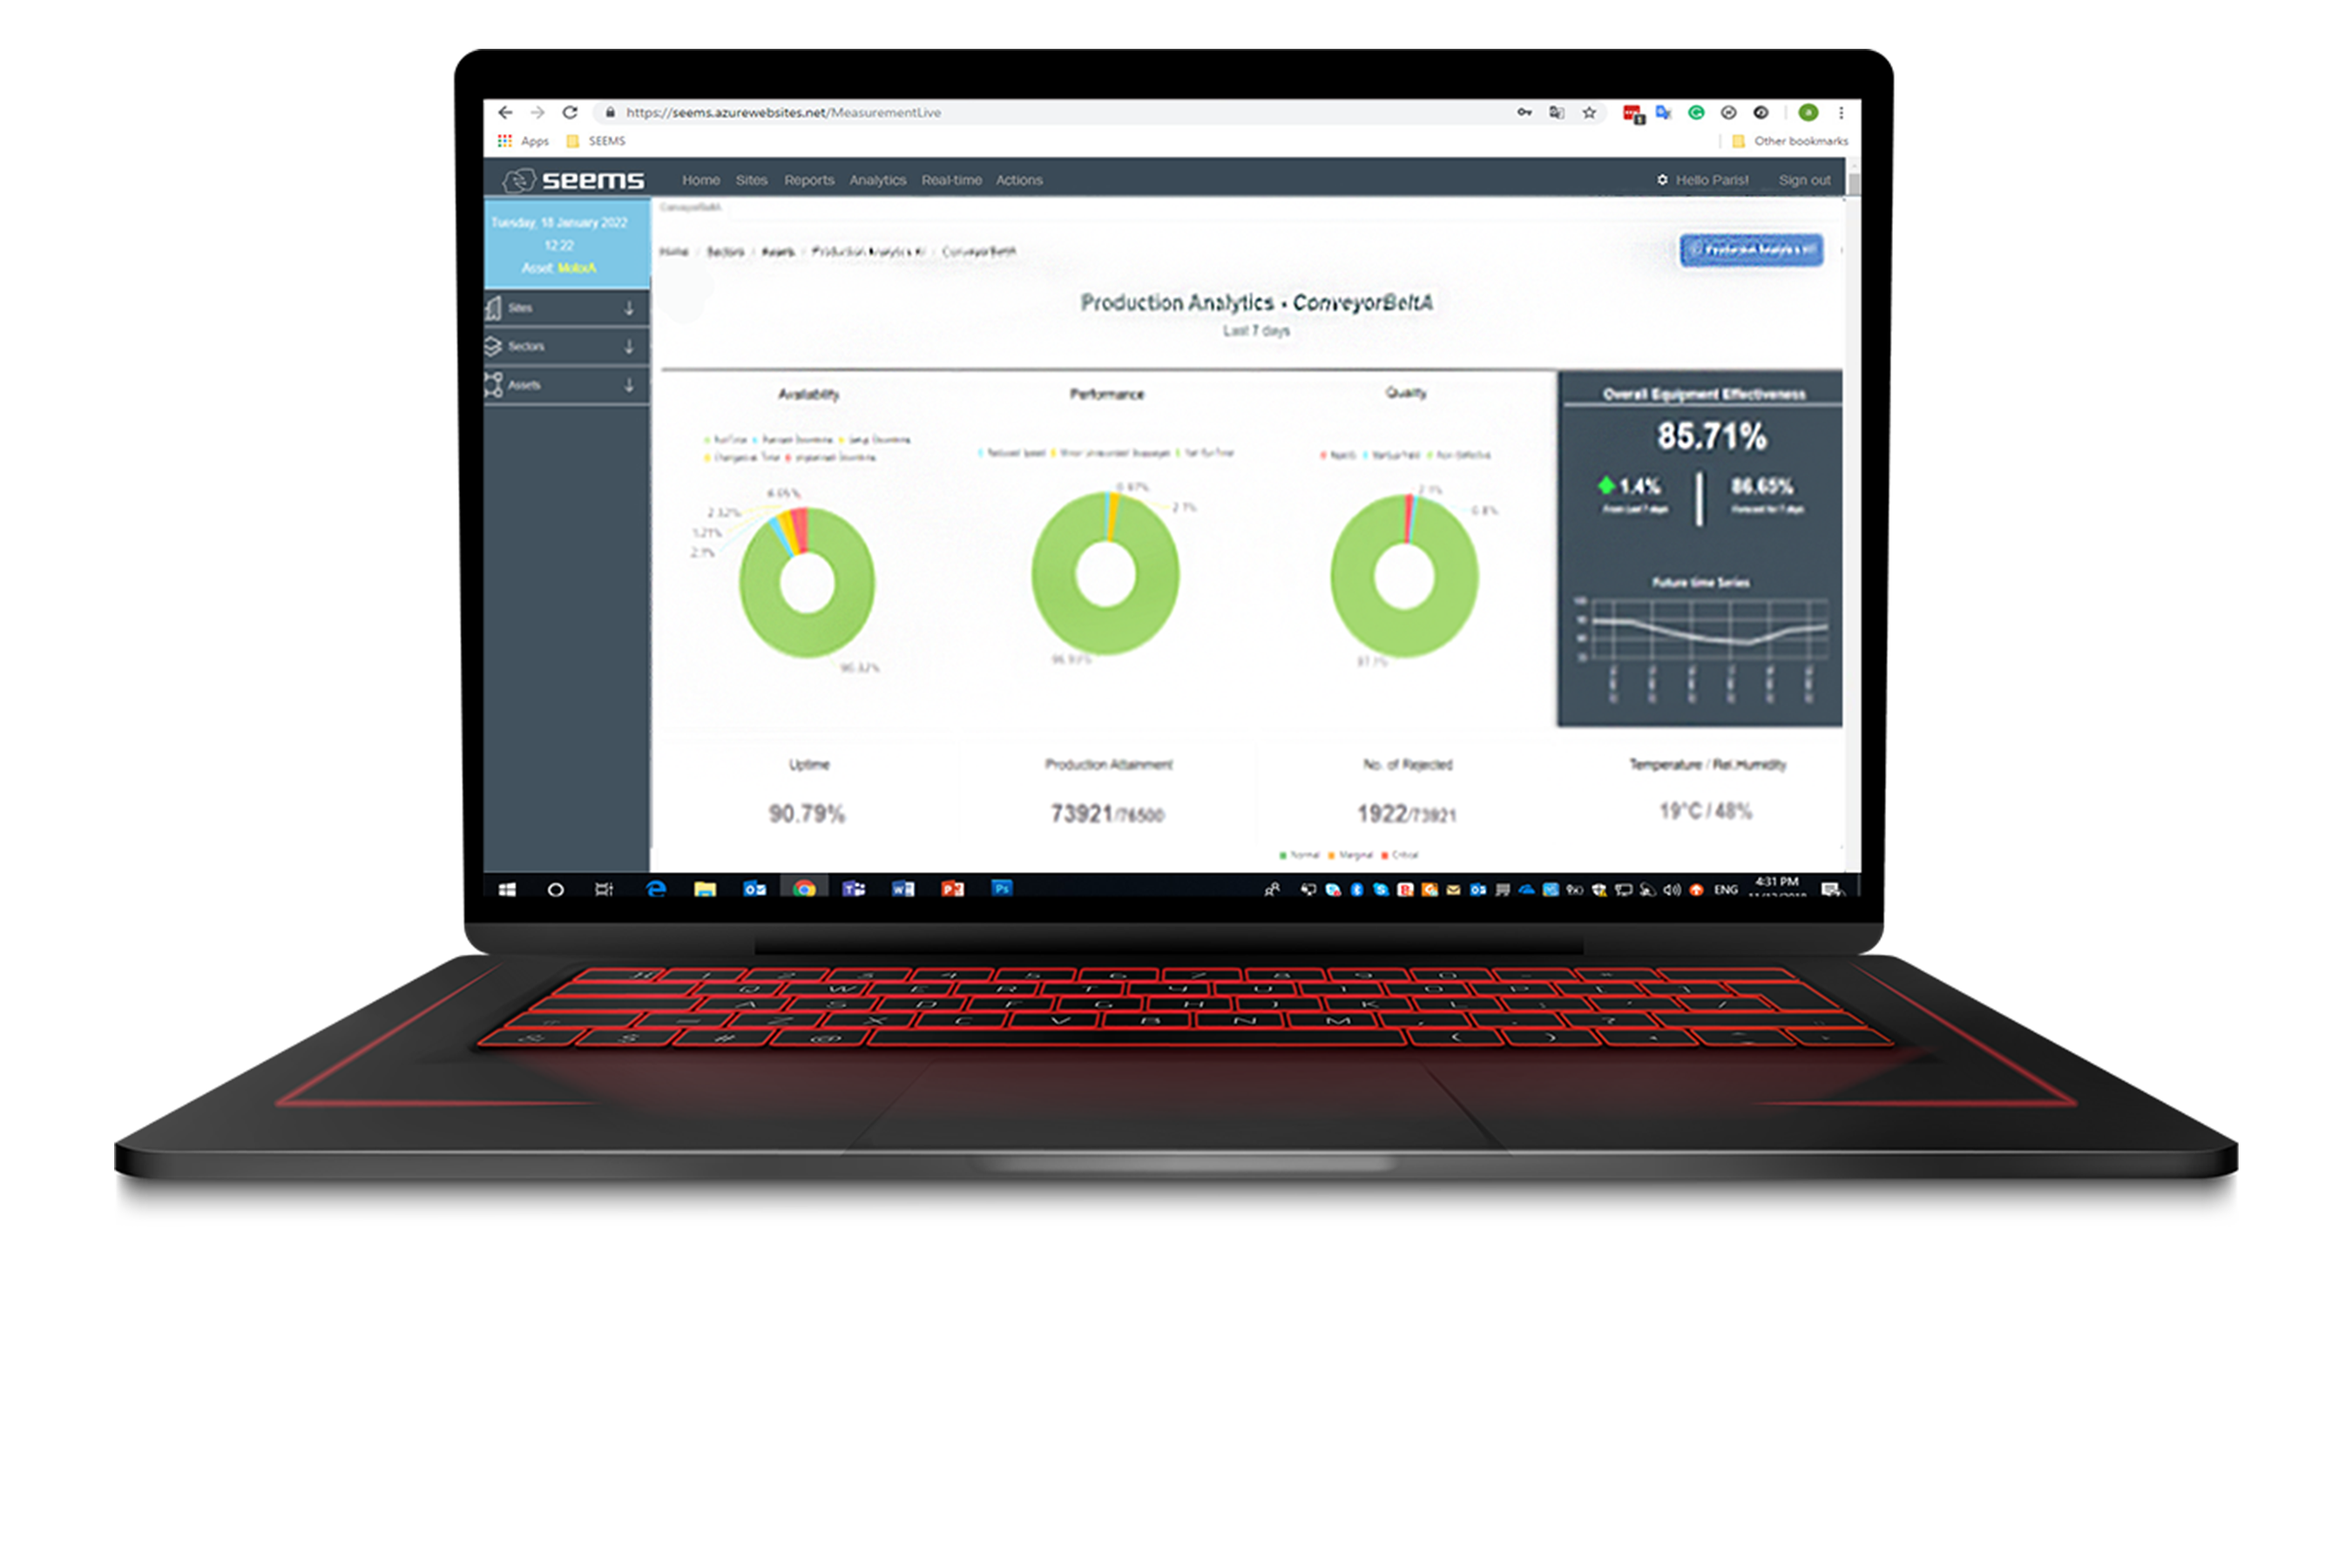
Overall Equipment Effectiveness (OEE) & Personnel (OLE).
Production Attainment
Runtime & Downtimes.
Production line speed.
Suggestions for improvement in real time.
Productivity trends and predictions.
Root-Cause analysis of downtimes.
Products counting
Performance map (heatmap).
Production analytics based on product history.

Production runtime.
Counting defective products.
▶ Increased equipment performance and productivity
▶ eduction of operational production costs
▶ Reduction of equipment downtime
▶ Reduction of maintenance costs
▶ Increased asset availability
▶ Customer satisfaction and business reputation maintained
▶ Reduction in product recall costs and lost materials
▶Product quality assurance
▶ Compliance with international regulations
▶ Payback in less than 12 months
